Key Takeaways
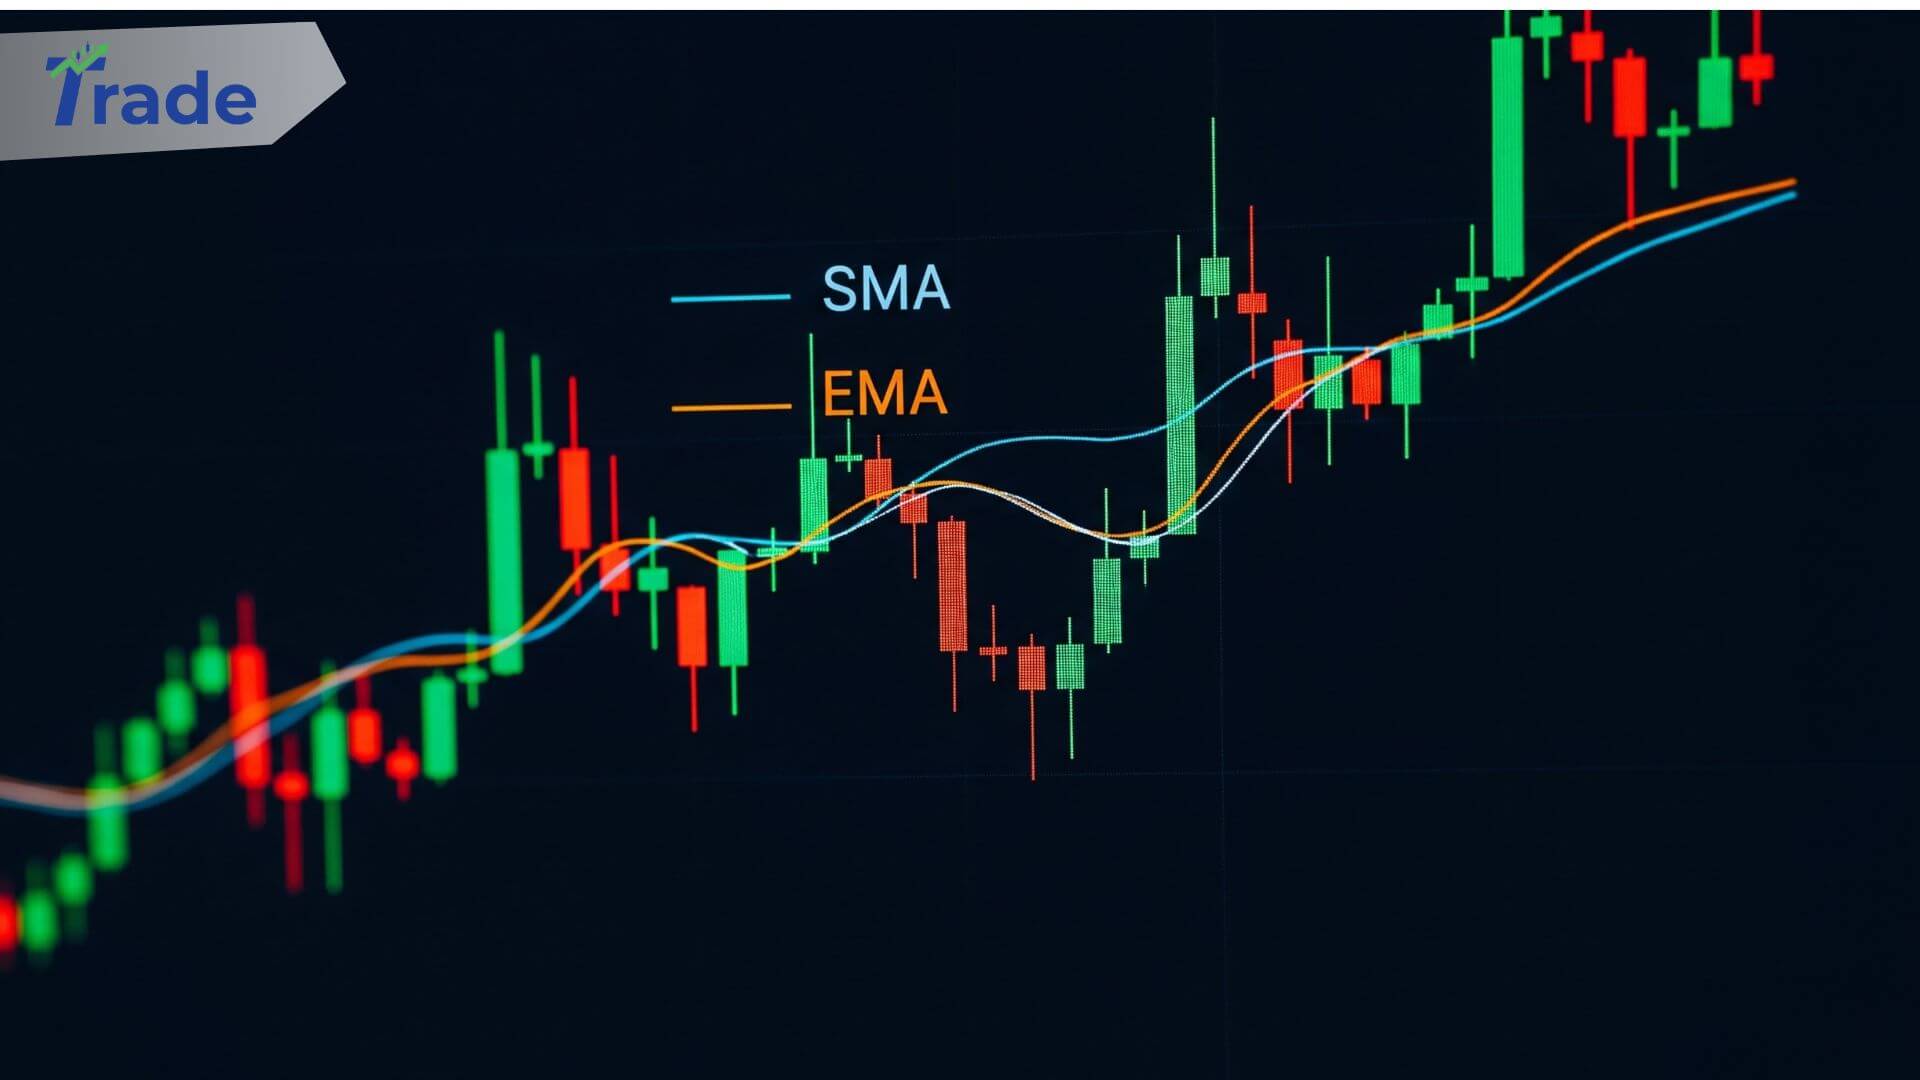
- EMA prioritizes recent price action, reacting faster to sudden market shifts.
- SMA offers smoother lines, filtering out market noise better for long-term trends.
- Day traders often prefer EMA to catch early entry signals and manage tight stops.
- Swing traders favor SMA to identify reliable support and resistance levels.
- Lag is the deciding factor: EMA reduces lag, while SMA accepts lag for stability.
Which is better: SMA or EMA?
Neither is objectively “better,” but they serve different purposes. The Exponential Moving Average (EMA) is superior for short-term, high-frequency trading because it reacts quickly to recent price changes.
The Simple Moving Average (SMA) is better for swing trading and long-term analysis as it smoothes out volatility and provides stronger support/resistance levels.
You have your charts open and your strategy ready. You go to add a trend indicator, but the settings menu stops you cold.
Period: 50.
Method: Simple or Exponential?
It seems like a minor switch, but choosing the wrong one can mean the difference between catching a breakout and getting stopped out by noise.
In this breakdown, we compare the math, the “lag,” and the specific use cases for both so you can stop guessing and start trading with the right tool.
🧾 Comparison Table About SMA vs. EMA
| Feature | Simple Moving Average (SMA) | Exponential Moving Average (EMA) | Winner For |
| Calculation | Average of closing prices over X periods (Equal weight). | Weighted average giving more value to recent prices. | N/A |
| Sensitivity | Low. Reacts slowly to price spikes. | High. Reacts immediately to price spikes. | Volatile Markets |
| Lag | Higher lag. Follows price at a distance. | Lower lag. Hugs price action closely. | Trend Following |
| False Signals | Fewer. Filters out “whipsaws” well. | More frequent. Can be tricked by short spikes. | Risk Management |
| Best For | Support/Resistance, Swing Trading. | Entries, Exits, Day Trading. | Specific Styles |
Understanding the Simple Moving Average (SMA)
The rock-solid standard for identifying long-term trend direction.
The SMA is the most basic form of a moving average. It takes the sum of past closing prices over a specific period and divides it by that number of periods. If you are looking for the simple moving average calculation, it treats a price from 50 days ago with the exact same importance as the price from yesterday.
This equal weighting creates a smoother line. For traders who want to see the “bigger picture” without being distracted by every minor price twitch, the SMA is ideal. It effectively ignores the noise of a random Tuesday news spike, keeping your focus on the macro trend.
Key Characteristics:
- Stability: It doesn’t change direction easily.
- Support/Resistance: Institutional traders often watch major SMAs (like the 200-day) as dynamic support zones.
- Context: If you are new to these concepts, read our The Ultimate Guide to Moving Averages for a foundational overview.
Understanding the Exponential Moving Average (EMA)
The fast-twitch indicator built for speed and recent price reaction.
The EMA was designed to fix the “slowness” of the SMA. The exponential moving average formula applies a multiplier to the most recent data points. This means what happened in the last few candles matters significantly more than what happened 20 candles ago.
Because of this weighting, the EMA turns faster. When price reverses, the EMA curves immediately to follow it, whereas the SMA takes a while to “realize” the trend has changed. This sensitivity makes it a favorite among traders who need to enter or exit positions quickly based on momentum.
Key Characteristics:
- Speed: Hugs price action tightly.
- Reaction: identifying trend reversals earlier than the SMA.
- Risk: The speed comes at a cost—it is more prone to fake-outs during chopping markets.
The “Lag” Problem in Trading
Lag defines the delay between price movement and indicator reaction.
Every moving average is a “lagging” indicator because it relies on past data. However, the degree of lag in trading varies significantly between these two tools.
- The SMA Lag: Because old data weighs as heavily as new data, an SMA takes longer to turn. By the time an SMA crossover confirms a trend change, the price may have already moved significantly.
- The EMA Advantage: The EMA reduces this lag. It isn’t predictive—it doesn’t tell you the future—but it tells you what is happening right now faster than the SMA does.
This speed is critical when you are trading fast-moving strategies. If you rely on crossovers for entries, using an EMA can get you in earlier. For more on this, check out our guide on The Moving Average Crossover Strategy.
Which One Fits Your Style?
Matching the mathematical formula to your daily trading routine.
Choosing between sma vs ema ultimately comes down to your time horizon and patience level. Here is how different traders utilize them.
1. The Day Trader (Scalper)
Best Choice: EMA
If you are looking for the best moving average for day trading, the EMA is usually the winner. Day traders capitalize on small price movements. You cannot afford to wait for a lagging SMA to confirm a move that might only last 15 minutes. The EMA allows you to:
- Ride short-term momentum.
- Place tighter stop-losses trailing the price.
- Exit quickly when the trend loses steam.
2. The Swing Trader
Best Choice: SMA
Swing traders hold positions for days or weeks. You don’t care about the hourly volatility; you care about the weekly trend. The EMA might fake you out during a temporary pullback, causing you to close a good trade too early. The SMA ignores that noise, keeping you in the trade until the actual trend breaks.
3. The Hybrid Approach
Best Choice: Both
Many traders use them in tandem. For example, a trader might use a 20 EMA for entry triggers (speed) but keep a 200 SMA on the chart to see the major trend direction (stability).
Still unsure which one suits your needs? The best way to learn is by doing. Test both indicators risk-free on a No Deposit Bonus Forex demo account and see which line aligns with your eye.
Conclusion
There is no “magic” moving average that prints money. The SMA offers clarity and stability, while the EMA offers speed and sensitivity. If you hate getting stopped out by noise, stick to the SMA. If you hate missing the start of a trend, switch to the EMA.
FAQs About SMA vs. EMA
What is the main difference between SMA vs EMA?
The main difference is sensitivity. SMA calculates the average of all prices equally, while EMA applies more weight to recent prices, making it react faster to market changes.
Which moving average is better for day trading?
The EMA is generally better for day trading. Its calculation reduces lag, allowing traders to react quickly to short-term price volatility and enter trades earlier than with an SMA.
Does the EMA give more false signals?
Yes, because the EMA is highly sensitive to recent price spikes, it can produce “whipsaws” (false signals) during sideways or choppy markets more often than the smoother SMA.
What is the best EMA setting for a 15-minute chart?
Common settings for 15-minute charts include the 9 or 20 EMA for short-term momentum and the 50 EMA for trend direction. Settings depend on volatility.
Can I use both SMA and EMA together?
Absolutely. Many traders use a long-term SMA (like the 200) to define the overall trend and a short-term EMA (like the 9 or 20) to time specific entries and exits.
Why do institutional traders prefer the 200 SMA?
Institutions prefer the 200 SMA because it represents a full year of trading data. It provides a stable, widely recognized benchmark for major support and resistance levels that isn’t easily swayed by daily noise.