Key Takeaways
- Moving averages (MAs) smooth out price data to reveal the true underlying trend.
- They function as dynamic support and resistance levels rather than fixed price lines.
- SMA offers stability for long-term trends, while EMA reacts faster to recent volatility.
- The slope of the MA line indicates whether the market is in an uptrend, downtrend, or ranging.
- MAs are lagging indicators, meaning they confirm trends rather than predict the future.
What Is a Moving Average?
A moving average is a technical analysis indicator that calculates the average price of an asset over a specific period to smooth out short-term price fluctuations. By filtering out random noise, it creates a single flowing line that helps traders visualize the direction of the trend more clearly.
Trading often feels like trying to find a signal in static. Prices spike and drop for no fundamental reason. If you focus on every single candle, you will miss the bigger picture. Moving averages strip away that noise, allowing you to see if a stock or pair is actually climbing or just experiencing a temporary blip.
In this guide, you will learn exactly how to interpret this essential tool and how to apply it to your charts today.
Why Do Traders Use Moving Averages?
Moving averages are the backbone of technical analysis because they simplify complex price action into a readable trend.
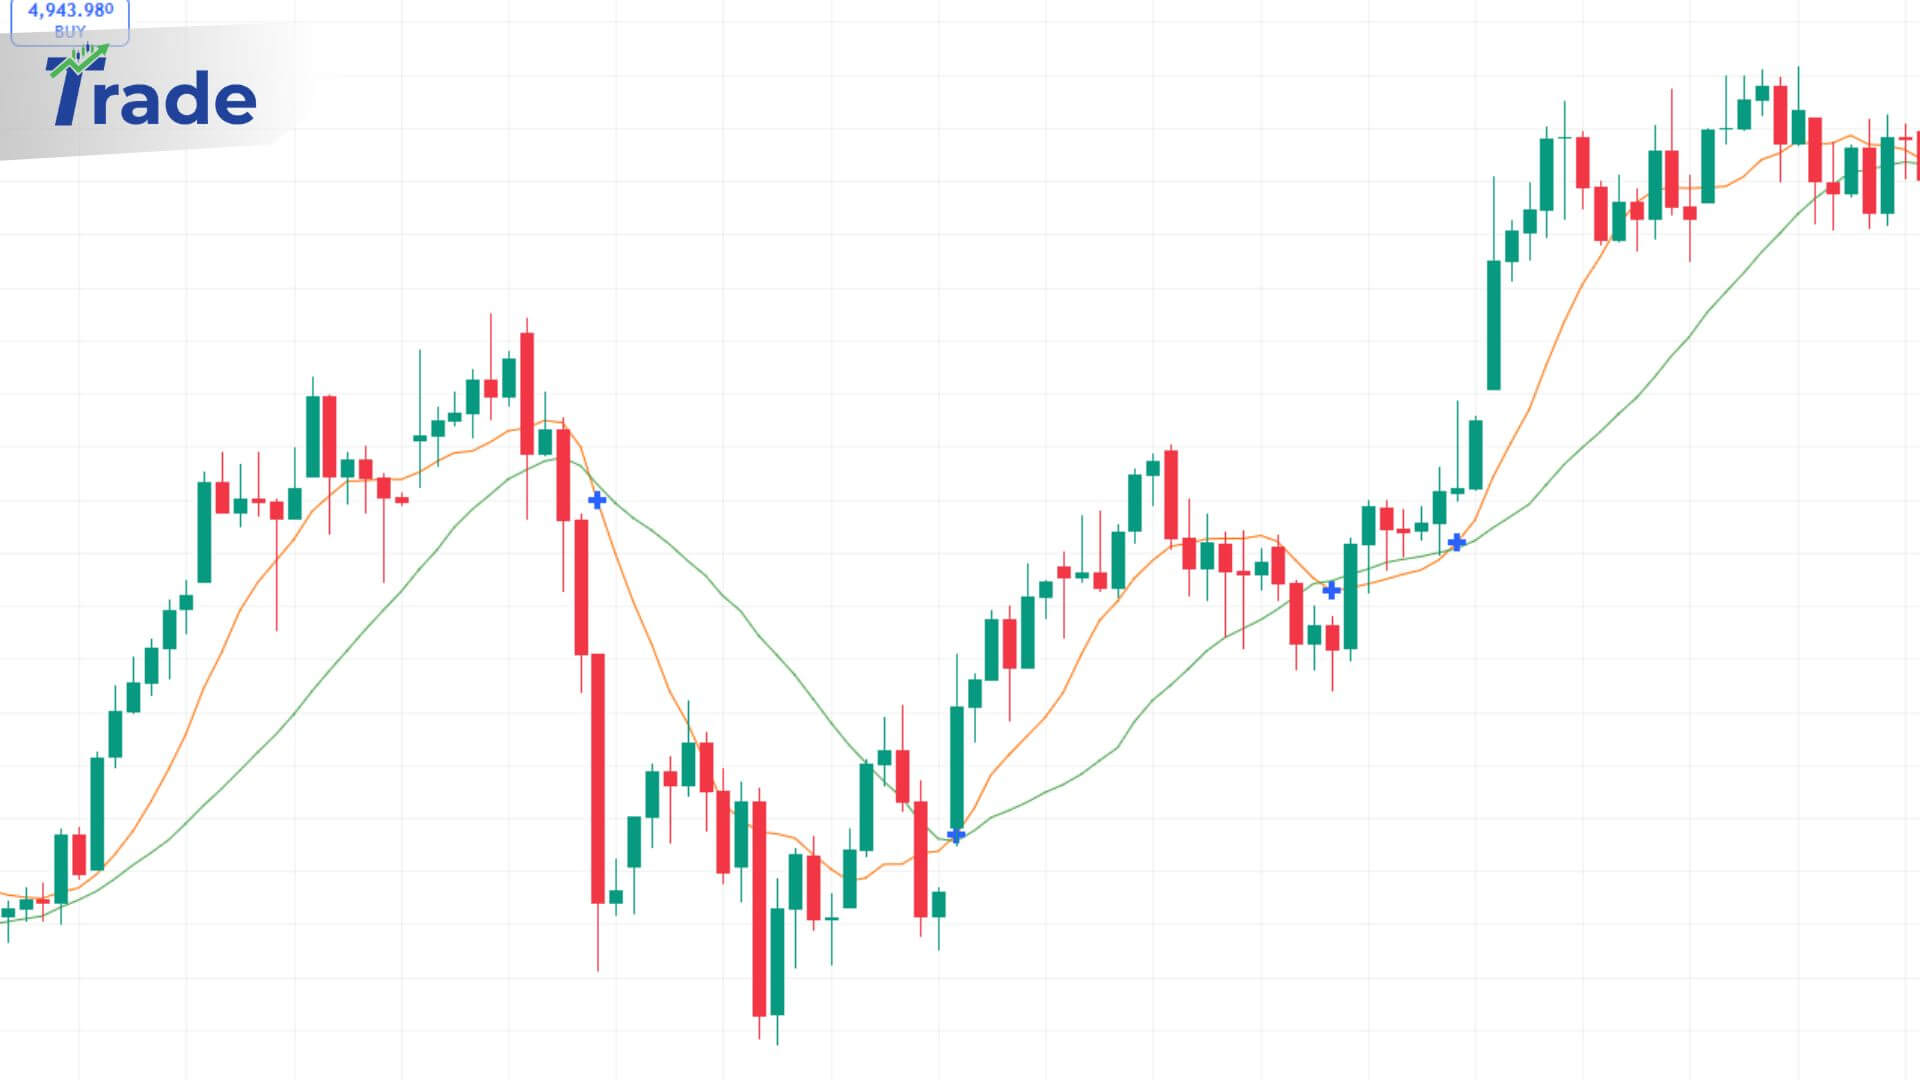
When you look at a raw price chart, the volatility can be overwhelming. Traders use MAs primarily to identify the direction of the trend. If the price is generally moving above the average, the asset is likely in an uptrend. If it’s below, it’s a downtrend.
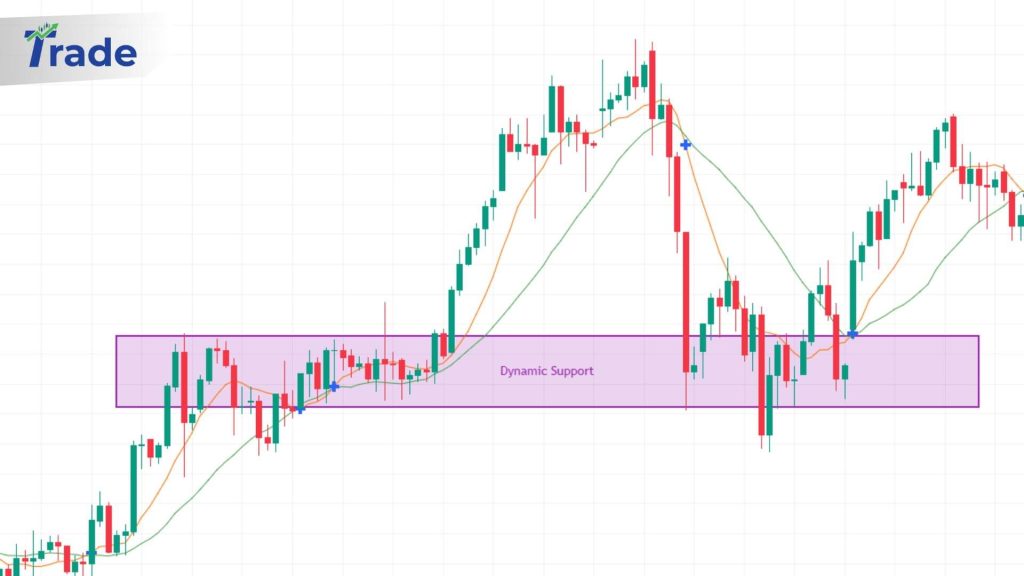
Beyond just direction, moving averages often act as dynamic support and resistance. Unlike a horizontal line drawn at a specific price (like $100), a moving average changes with the data.
Trader Insight: “Think of the moving average as a floor in an uptrend. Prices may bounce off this ‘floor’ multiple times, offering low-risk entry points.”
Common Uses:
- Trend Identification: Quickly determining if the market is bullish or bearish.
- Support & Resistance: Finding areas where price might bounce or reject.
- Crossovers: Identifying potential entry signals when two MAs cross paths.
The Difference Between SMA and EMA
While both track price trends, the Simple Moving Average (SMA) treats all data equally, whereas the Exponential Moving Average (EMA) prioritizes recent prices.
Understanding this distinction is critical for your strategy. The Simple Moving Average takes the arithmetic mean of a given set of prices. For example, a 10-day SMA adds the closing prices of the last 10 days and divides by 10. It is stable but slow to react.
The Exponential Moving Average applies a weighting factor to the most recent data. This makes it more sensitive to new information. Day traders often prefer the EMA because it signals trend changes faster, though it can also produce more false signals during choppy markets.

For a deeper dive into which one fits your specific style, check out our dedicated guide: SMA vs. EMA: Which One Should You Use?
Comparison: SMA vs. EMA
| Feature | Simple Moving Average (SMA) | Exponential Moving Average (EMA) |
| Calculation | Average of prices over n periods | Weighted average emphasizing recent data |
| Reaction Speed | Slow and smooth | Fast and reactive |
| Best For | Long-term trend following | Short-term trading & volatile markets |
| False Signals | Fewer false signals | More prone to false signals (whipsaws) |
| Primary Benefit | Filters out noise effectively | Catch trends early |
How to Read a Moving Average
Reading a moving average comes down to observing the slope of the line and the price’s position relative to it.
You do not need complex math to use this tool effectively. Visual cues tell you most of what you need to know.
1. Check the Slope
The angle of the moving average gives you the strength of the trend.
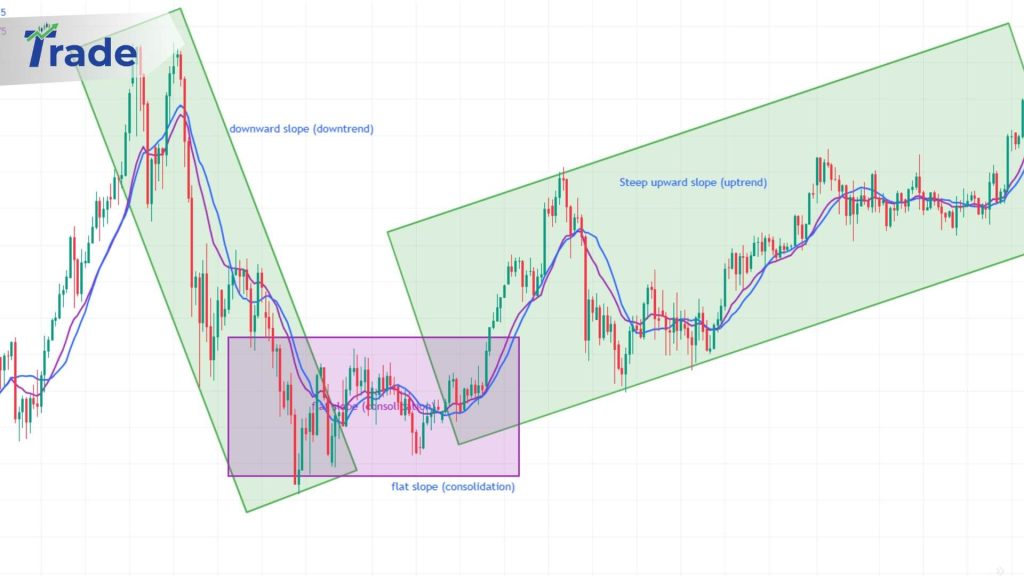
- Steep Upward Slope: Strong uptrend. Buyers are aggressively pushing prices higher.
- Flattening Slope: Momentum is slowing down. The market may be consolidating or preparing to reverse.
- Downward Slope: Downtrend. Sellers are in control.
2. Price Relation
Look at where the current price sits in relation to the line.
- Price Above MA: generally confirms a bullish sentiment.
- Price Below MA: generally indicates bearish sentiment.
Real-World Example:
If you are trading Bitcoin and the price crosses above the 50-day moving average while the line itself starts sloping up, technical analysis indicators suggest a new uptrend may be forming.
Ready to start plotting these lines? See our top picks for Top Broker to set up your indicators.
Conclusion
The moving average definition is simple, but its application is powerful. It allows you to filter out the noise and focus on the true direction of the market. Whether you use a slow SMA to ride long trends or a fast EMA to scalp the markets, this tool remains a cornerstone of successful trading.
Start by adding a single moving average to your chart today. Watch how price reacts to it, and you will begin to see the hidden structure behind the market chaos.
FAQs: Understanding Moving Averages
What is the best moving average for day trading?
For day trading, shorter periods like the 9-period or 20-period EMA are popular because they react quickly to price changes, allowing traders to capture short-term moves.
How do you calculate a moving average?
To calculate a simple moving average, add the closing prices of an asset for a set number of periods (e.g., 10 days) and divide that sum by the number of periods (10).
What is the “Golden Cross”?
A Golden Cross occurs when a short-term moving average (like the 50-day) crosses above a long-term moving average (like the 200-day). It is considered a major bullish signal.
Can moving averages predict future prices?
No. Moving averages are lagging indicators. They are based on past data and confirm existing trends rather than predicting future price movements.
Why do traders use the 200-day moving average?
The 200-day SMA is widely watched by institutions and banks. It is considered a major dividing line between a long-term bull market and a bear market.
Do moving averages work in sideways markets?
Moving averages often fail in ranging or sideways markets. Since they rely on trends, they can produce multiple false signals (whipsaws) when prices move horizontally.