Key Takeaways
- Forex trends respect the 50-period SMA due to high institutional volume on pairs like EUR/USD.
- The “20 & 50” combo balances short-term momentum entries with medium-term trend filtration.
- Dynamic support and resistance allows traders to buy dips without guessing arbitrary price levels.
- Multi-timeframe analysis (15m/1H/4H) prevents entering trades against the dominant daily trend.
- Scalping strategies require faster indicators like the 9 or 10 EMA to capture quick pips.
Which Moving Average is Best for Day Trading?
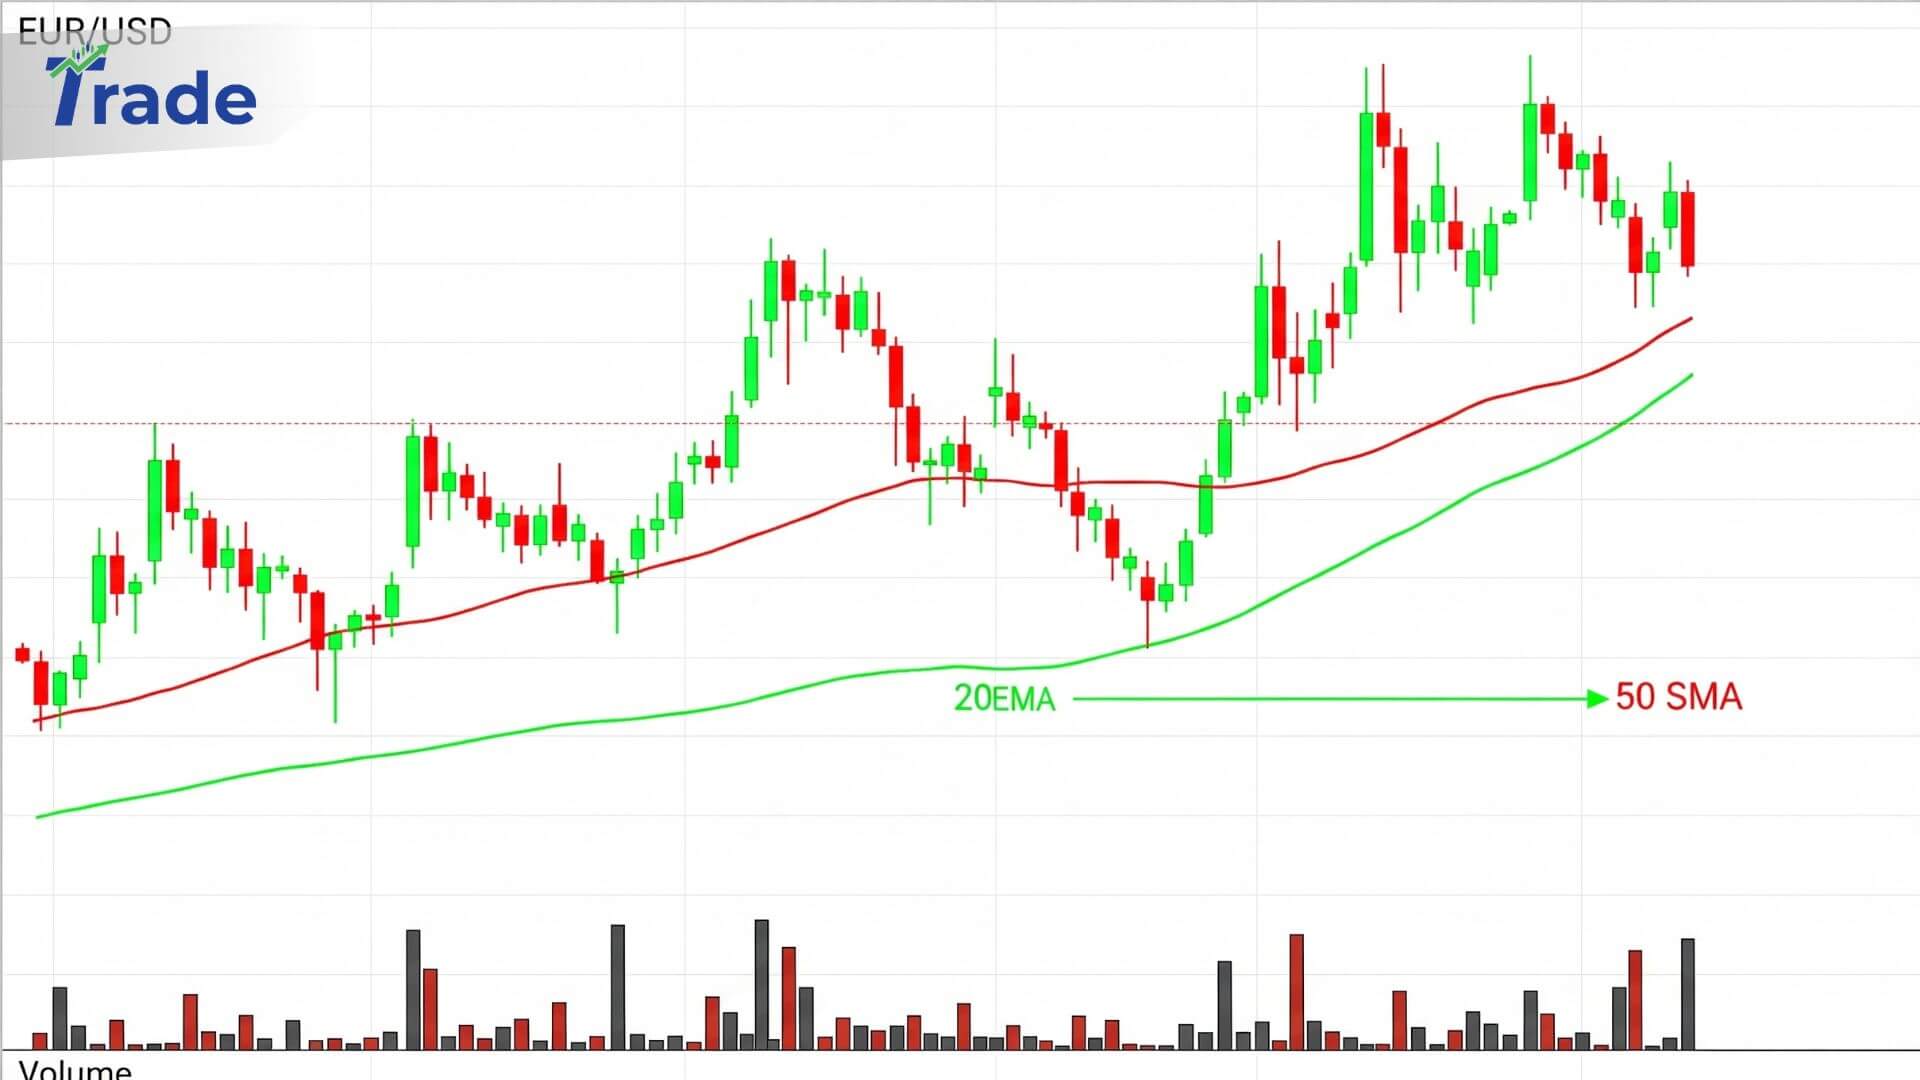
For Forex day trading, the 20-period Exponential Moving Average (EMA) combined with the 50-period Simple Moving Average (SMA) is the gold standard. This specific combination allows traders to filter out market noise while identifying precise entry points during high-volatility sessions.
If you’ve been getting stopped out by “whipsaws” or entering trends just as they end, your moving average settings are likely too slow for the 24-hour currency market.
Unlike stocks, Forex pairs like EUR/USD and GBP/JPY never sleep, meaning you need indicators that adapt to overnight liquidity shifts.
This guide breaks down the exact settings, timeframes, and execution rules professional day traders use to scalp and swing trade currency pairs.
🧾 Strategy Comparison: MA Settings by Trading Style
| Trading Style | Primary Timeframe | Moving Average 1 (Trigger) | Moving Average 2 (Trend) | Best For |
| Scalping | 1-Min / 5-Min | 9 EMA | 20 EMA | Catching rapid momentum bursts on GBP/USD. |
| Day Trading | 15-Min / 1-Hour | 20 EMA | 50 SMA | Intraday trends on liquid pairs like EUR/USD. |
| Swing Trading | 4-Hour / Daily | 50 SMA | 200 SMA | Riding multi-day trends with lower screen time. |
| Trend Following | Daily | 100 SMA | 200 SMA | Institutional-level trend identification. |
The Best Timeframes for FX Day Trading
The “Holy Trinity” of Forex timeframes—15m, 1H, and 4H—provides the perfect balance of detail and context.
Forex markets are fractal, meaning a trend on one timeframe can be a correction on another. To trade moving averages successfully, you must align your charts using a top-down approach.
- 4-Hour Chart (Trend): Use this to determine the overall bias. Is price above or below the 50 SMA? If it’s above, you only look for Buy signals.
- 1-Hour Chart (Setup): This is your “workstation.” Look for the price to pull back to the 20 EMA or form a consolidation pattern.
- 15-Minute Chart (Entry): This is the “trigger.” Once the 1H setup is clear, drop to the 15m chart to fine-tune your entry, reducing your stop-loss distance and increasing your Risk-to-Reward ratio.
Expert Insight: Never enter a trade on the 15-minute chart if the 1-hour chart shows the moving averages crossing against you. Alignment is non-negotiable.
The 20 & 50 Period Strategy (The “Trend Surfer”)
Bold summary: A robust intraday strategy that uses the 50 SMA to define the trend and the 20 EMA to time the entry.
This is the bread-and-butter strategy for day traders targeting 20–50 pips per trade. It works exceptionally well on EUR/USD and AUD/USD because these pairs tend to trend cleanly during the London and New York overlaps.
1. The Setup (Long Trade Example)
- Trend Filter: Price must be trading cleanly above the 50 SMA. The angle of the 50 SMA should be sloping upwards, not flat.
- The Pullback: Wait for price to retrace and touch (or get very close to) the 20 EMA. Do not chase the price when it is far extended from the moving averages.
- The Trigger: Look for a bullish candlestick pattern (e.g., Hammer, Bullish Engulfing) rejecting the 20 EMA zone.
2. Stop Loss & Take Profit
- Stop Loss: Place your stop 5–10 pips below the 50 SMA. If the price breaks the 50 SMA with conviction, the trend is likely invalid.
- Take Profit: Use a trailing stop. As long as the price closes above the 20 EMA, stay in the trade. Alternatively, target a fixed 1:2 Risk-to-Reward ratio.
Want to understand the technical foundations before diving in? Read our Ultimate Guide to Moving Averages for a primer on SMA vs. EMA calculations.
Using MAs as Dynamic Support/Resistance
Bold summary: In strong Forex trends, horizontal lines often fail—moving averages act as the “floor” that price bounces off.
Unlike stocks, which have static opening and closing prices, Forex flows continuously. This creates dynamic support and resistance levels that move with time.
When a currency pair is “trending,” it rarely moves in a straight line. It moves in waves. During a strong uptrend, the 50-period SMA often acts as a dynamic floor. Traders waiting for a horizontal support level from three days ago might miss the entry entirely because buyers step in earlier—right at the moving average.
How to Trade the Bounce
- Identify a pair with a steep moving average slope (e.g., GBP/JPY).
- Place a “Limit Order” near the 50 SMA or wait for a price reaction.
- Confirmation: Watch for the “wick.” If a candle pierces the moving average but closes back above it (leaving a long tail), this confirms that institutional algorithms are buying the dip.
Executing Trades on High-Volatility Pairs
Bold summary: Volatile pairs like GBP/JPY require wider moving average settings to avoid “stop hunts” and fake-outs.
Trading high-beta pairs or “crosses” can be lucrative but dangerous. A standard tight moving average strategy might get you stopped out by random noise before the real move begins.
For these pairs, rely more heavily on the 50 SMA rather than the faster 20 EMA for your stop-loss placement. The 50 SMA absorbs the volatility spikes that characterize the London Open.
If you are ready to apply these strategies in a live high-speed environment, ensure your broker offers the execution speed required for volatile markets. Check out our Lowest Spread Forex Brokers to find platforms optimized for technical day trading.
Conclusion
Forex day trading isn’t about predicting the future; it’s about reacting to the present. The 20 & 50 Moving Average strategy gives you a logical framework to interpret market chaos. It tells you when to be aggressive (price at 20 EMA) and when to sit on your hands (price inside the averages).
Discipline is the only indicator that never lags. Stick to the rules, wait for the pullback, and let the moving averages guide your risk.
FAQs About Moving Average Strategies for Forex
What is the best moving average setting for scalping?
For scalping on 1-minute or 5-minute charts, a combination of the 9 EMA (fast) and 20 EMA (slow) is ideal. The 9 EMA reacts quickly to price bursts, allowing you to enter and exit momentum trades rapidly.
Can I use this strategy on Crypto or Stocks?
Yes, but with adjustments. Crypto markets are more volatile, so you may need to use a 200 EMA as your main trend filter. Stocks often respect the 20 SMA on daily charts more than Forex pairs do.
What is a “Golden Cross” in Forex?
A Golden Cross occurs when a short-term moving average (usually the 50 SMA) crosses above a long-term moving average (usually the 200 SMA). It is a major bullish signal indicating a potential long-term trend reversal.
Why do moving averages lag?
Moving averages are calculated based on past closing prices, so they inherently trail the current market price. This “lag” is actually a feature, not a bug—it helps smooth out noise and confirm that a trend is genuine rather than a temporary spike.
How do I avoid false signals (whipsaws)?
To avoid false signals, never trade when the moving averages are flat or moving horizontally. Only take trades when the averages are angled (sloping) clearly up or down, indicating momentum.
Should I use SMA or EMA for day trading?
EMA (Exponential Moving Average) is generally better for day trading because it gives more weight to recent price data, reacting faster to sudden news or volatility than the slower SMA.