Key Takeaways
- MACD alone is insufficient; it generates false signals during market consolidation.
- The 200 EMA acts as a trend filter, ensuring you only trade in the direction of dominant momentum.
- Buy signals require price above the 200 EMA and a bullish MACD crossover.
- Sell signals require price below the 200 EMA and a bearish MACD crossover.
- Strict risk management uses recent swing highs/lows for stop losses to protect capital.
The Moving Average Convergence Divergence (MACD) is a trend-following momentum indicator that shows the relationship between two moving averages of a security’s price.
While popular, trading every MACD crossover blindly often leads to losses in choppy markets. This guide details a mechanical system to filter noise and target high-probability setups.
Traders often abandon the MACD because it generates “fakeouts” when the market ranges sideways. By adding a simple trend filter, you can ignore low-quality signals and only execute trades when momentum is heavily in your favor.
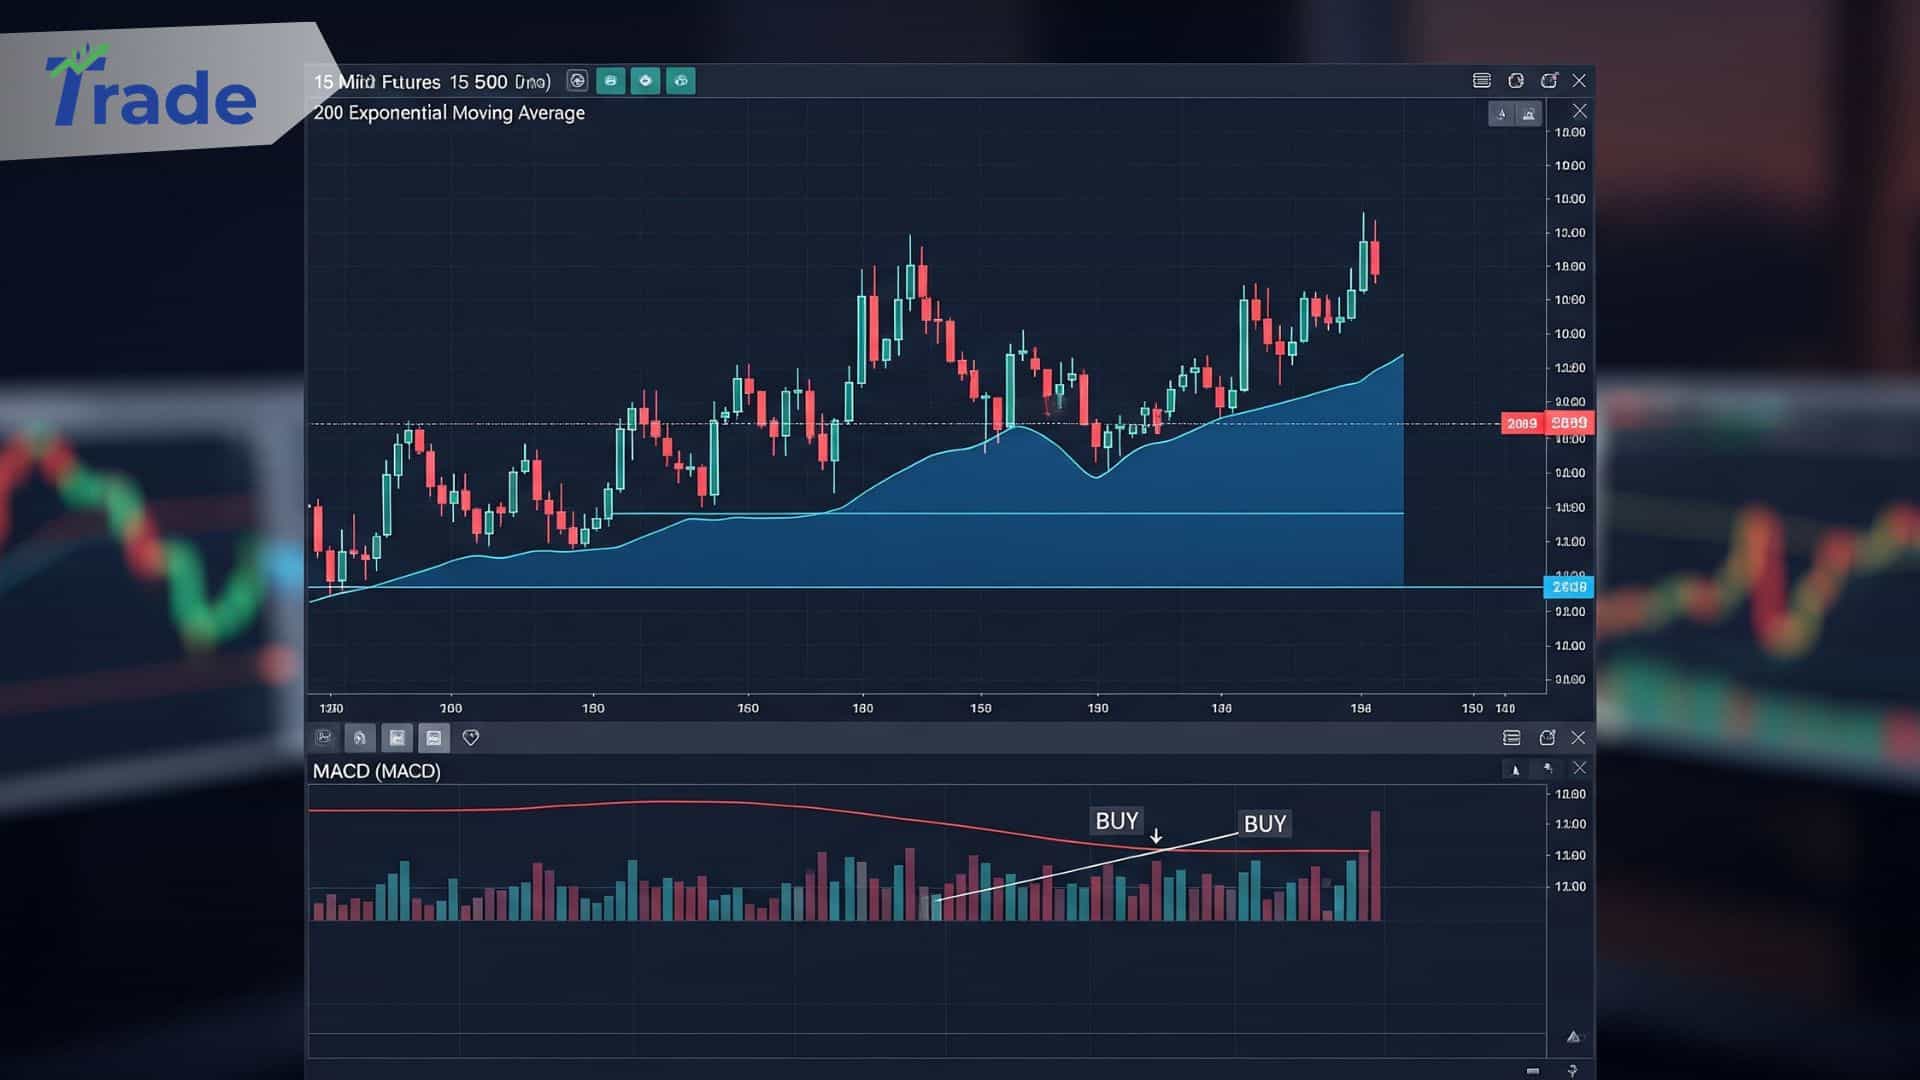
This strategy combines the MACD with the 200 Exponential Moving Average (EMA) to drastically improve strike rates.
Strategy Comparison: Standard vs. Filtered
(Difference between trading “Naked” MACD and this Optimized Strategy)
| Feature | Standard MACD Strategy | Trend-Filtered MACD Strategy |
| Primary Indicator | MACD (12, 26, 9) | MACD + 200 EMA |
| Market Condition | Fails in sideways/choppy markets | Avoids sideways markets |
| Signal Frequency | High (Many signals) | Low (High quality only) |
| Win Rate Potential | 40% – 50% | 60% – 80%+ |
| Risk Profile | High (Prone to false breakouts) | Moderate (Trades with trend) |
What Is the MACD Indicator and How Does It Work?
The MACD is composed of two moving averages and a histogram that measures momentum strength.
The indicator consists of the MACD line (fast) and the Signal line (slow). When the MACD line crosses the Signal line, it suggests a potential change in trend direction. The Histogram bars represent the distance between these two lines, showing whether bullish or bearish momentum is increasing or fading.
Trader’s Note: Many beginners treat the Histogram as a simple “Green means Buy, Red means Sell” tool. This is a mistake. The crossover of the lines is the trigger; the histogram confirms the strength of that move.
Why Do Most MACD Strategies Fail in 2025?
Market noise and consolidation periods create frequent false signals that drain trading accounts.
When the market moves sideways (ranging), the moving averages converge and diverge repeatedly without a clear direction. A standard MACD strategy will trigger a “Buy” signal, then immediately reverse to a “Sell” signal, causing you to get stopped out repeatedly. This is known as the “whipsaw” effect.
Real-World Scenario:
Imagine trading Bitcoin on a 15-minute chart during a quiet weekend. The price fluctuates between $95,000 and $95,200. The MACD might cross over five times in three hours. If you took every trade, you would lose money on spreads and fees five times in a row.
How Does the 200 EMA Filter Fix False Signals?
The 200 Exponential Moving Average (EMA) acts as a rigorous gatekeeper for your trades.
The 200 EMA displays the long-term trend. By implementing a strict rule—only trade Long when price is above the 200 EMA, and Short when below—you automatically align yourself with the institutional money flow. This immediately disqualifies the choppy, sideways movements that cause most losses.
Stat Block:
- Price > 200 EMA: Look for Longs (Buys) only. Ignore all Sell signals.
- Price < 200 EMA: Look for Shorts (Sells) only. Ignore all Buy signals.
What Are the Exact Rules for a Long (Buy) Trade?
A valid long setup requires confluence between trend location and momentum shift.
First, confirm the price candles are clearly trading above the 200 EMA. Do not trade if the price is touching or tangling with the line. Second, wait for the MACD line (usually Blue) to cross above the Signal line (usually Orange). Ideally, this crossover should happen below the “Zero Line” of the MACD, indicating the pullback is over and the upward trend is resuming.
Execution Checklist:
- Is Price > 200 EMA? Yes.
- Did MACD Line cross above Signal Line? Yes.
- Action: Enter Long immediately on candle close.
- Stop Loss: Place below the recent swing low.
What Are the Exact Rules for a Short (Sell) Trade?
Shorting requires the market to be in a verified downtrend before you pull the trigger.
Verify that price candles are trading below the 200 EMA. This confirms bears are in control. Wait for the MACD line to cross below the Signal line. A crossover happening above the Zero Line is often stronger, as it indicates a momentary rally has failed and the downtrend is continuing.
Execution Checklist:
- Is Price < 200 EMA? Yes.
- Did MACD Line cross below Signal Line? Yes.
- Action: Enter Short immediately on candle close.
- Stop Loss: Place above the recent swing high.
How Should You Manage Risk and Take Profit?
A high win rate means nothing if one bad trade wipes out your profits.
For this strategy, a fixed Risk-to-Reward (R:R) ratio is recommended. A 1.5 Risk-to-Reward ratio is a balanced starting point. This means if you risk $100 on a trade (your stop loss distance), your take profit target should be $150 away.
Expert Insight:
“Mechanical strategies require mechanical exits. Do not move your Stop Loss hoping the market will turn around. Trust the mathematics of the 200 EMA filter over time.”
Next Steps?
Ready to test this setup? Open your charting software, add the MACD (12, 26, 9) and EMA (200), and backtest the last 50 trades to see the results for yourself.
Conclusion
Consistency in trading comes from eliminating variables, not adding more indicators.
This MACD + 200 EMA strategy works because it accepts a simple truth: trading with the trend is easier than picking tops and bottoms. By ignoring signals that go against the long-term momentum, you protect your capital from choppy markets and focus only on high-probability setups. Stick to the rules, manage your risk, and let the probabilities play out.
FAQs About The Best MACD Strategy
What represents the best time frame for this MACD strategy?
This strategy is fractal, meaning it works on most time frames. However, the 15-minute, 1-hour, and 4-hour charts generally provide the best balance between signal frequency and reliability for day and swing trading.
Why do I need the 200 EMA specifically?
The 200 EMA is a widely watched institutional level. Because major banks and algorithms respect this moving average as a trend baseline, price action tends to react predictably around it, increasing the reliability of your trade entries.
How do I handle a losing trade with this system?
Losses are inevitable in any strategy. If price hits your stop loss, accept the result and wait for the next valid setup. Do not “revenge trade” or widen your stop loss to avoid taking the hit.
Do I need to change the default MACD settings?
The default settings (12, 26, 9) are effective because they are standard across the industry, making the signals self-fulfilling prophecies. Changing them is rarely necessary unless you have backtested a specific asset extensively.
Are there other indicators I should add?
Adding more indicators often leads to “analysis paralysis.” The combination of a trend filter (200 EMA) and a momentum trigger (MACD) is sufficient. Keep your chart clean to maintain clarity in decision-making.
Does this strategy work for Crypto and Forex?
Yes. Since this strategy relies on momentum and trend—fundamental aspects of supply and demand—it applies effectively to Forex pairs, Cryptocurrencies, and Stock Indices that exhibit strong trending behavior.