Key Takeaways
- Moving averages act as dynamic support levels where institutional investors often accumulate shares during uptrends.
- The 50-day MA tracks medium-term health, serving as the “buy zone” for swing traders entering pullbacks.
- The 200-day MA is the ultimate trend filter; buying below this line significantly increases the risk of failure.
- Effective screening requires price alignment, specifically looking for stocks trading above both the 50 and 200-day lines.
- Golden crosses signal major trend shifts, but they lag price action and work best as confirmation tools.
How Do Moving Averages Help Swing Traders?
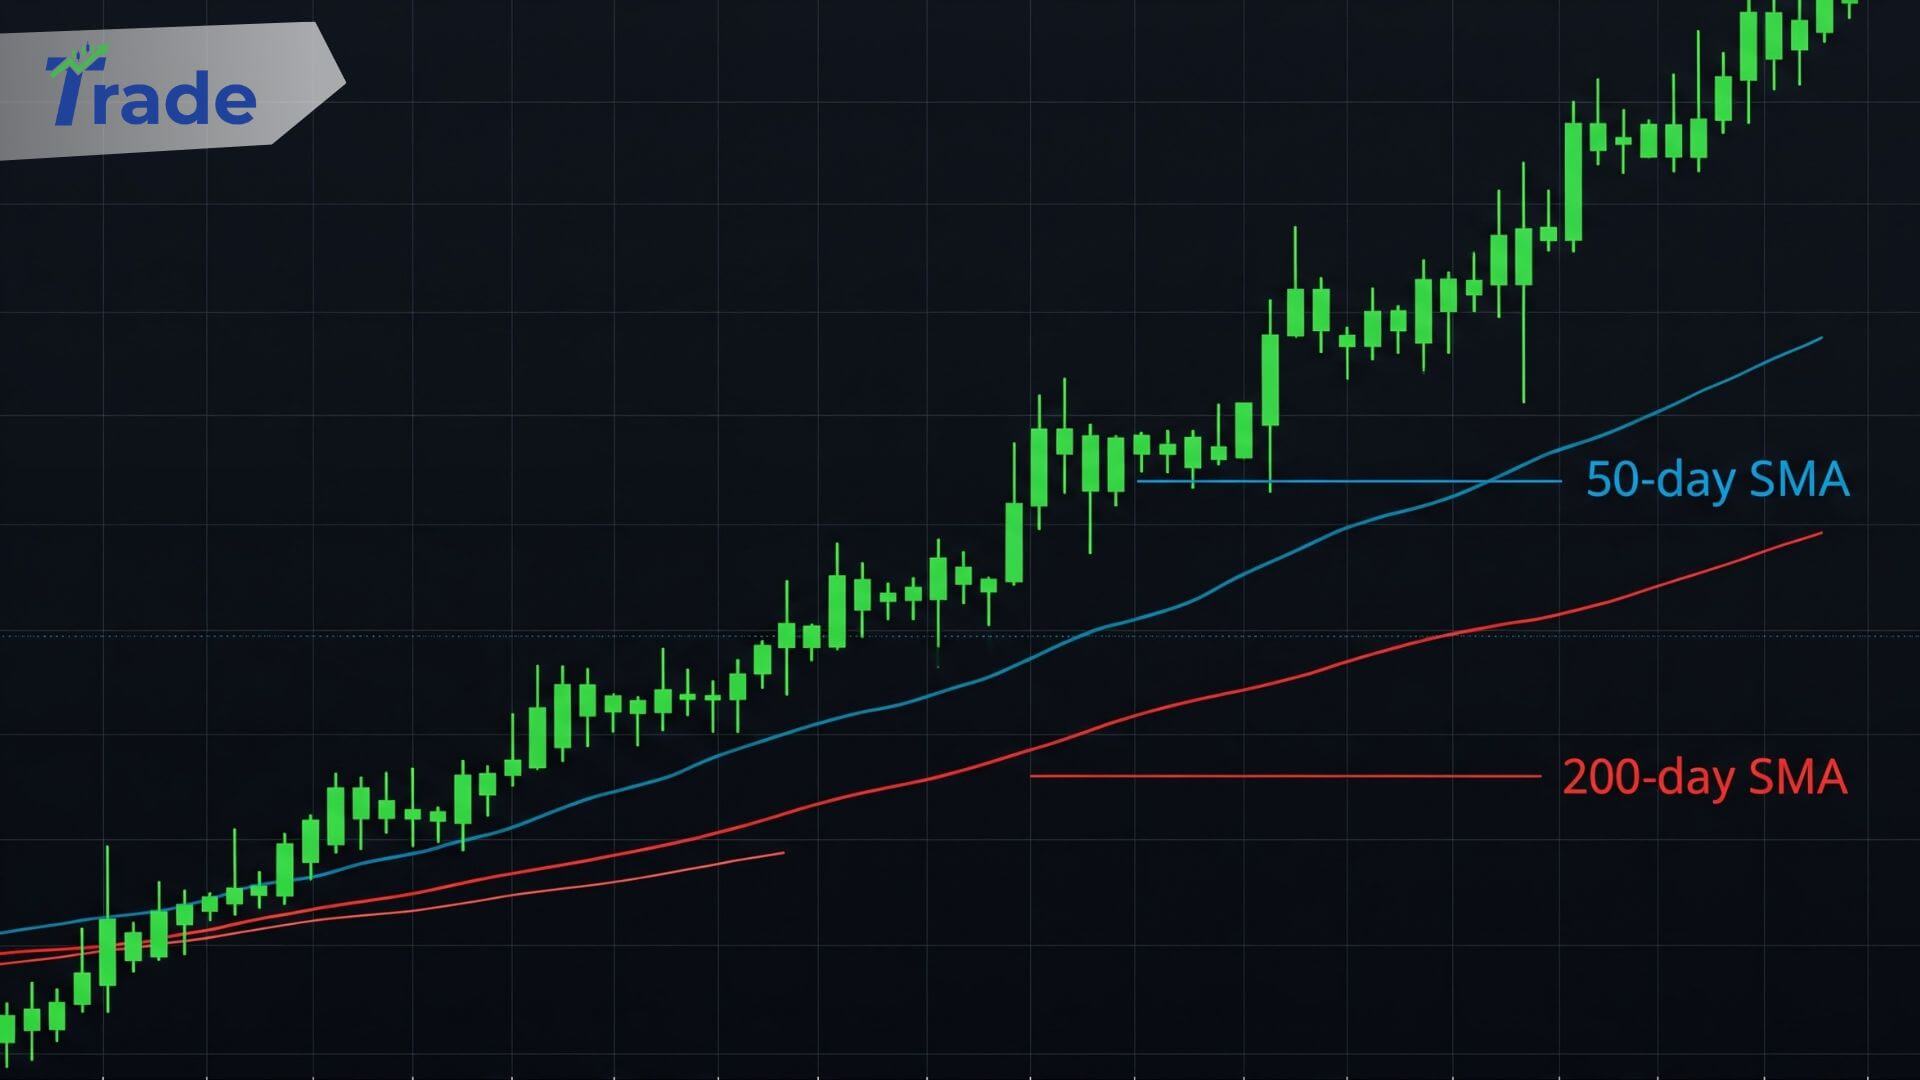
The 50 and 200-day moving averages help swing traders identify the dominant trend direction and potential entry points by smoothing out daily price noise. Instead of guessing tops and bottoms, traders use these lines to spot where “smart money” is supporting the stock price.
If you are trying to catch a falling knife, stop. The goal of using moving average stocks strategies is not to buy the absolute bottom, but to buy when the probability of a rally is highest. By aligning your trades with the major trend, you stop fighting the market flow and start riding the institutional wave.
📊 Indicator Breakdown: 50 vs. 200 Day MA
| Feature | 50-Day Moving Average | 200-Day Moving Average | Best For | Risk Profile |
| Trend Focus | Medium-term trend health | Long-term market sentiment | Trend Following | Moderate |
| Role | Dynamic Support / Entry Zone | Trend Filter / Major Floor | Pullback Entries | Low |
| Reaction Speed | Reacts faster to price changes | Slow, steady, lags price | Swing Trading | Low |
| Key Signal | Bounce off the line | Price crossing above/below | Timing Entries | High (if ignored) |
| Who Watches? | Active Funds & Swing Traders | Banks & Pension Funds | Position Sizing | Low |
The ‘Institution’s Line’: The 50-Day MA
The 50-day moving average is widely considered the “line in the sand” where institutional investors step in to defend their positions.
For a swing trader, the 50-day MA is your primary tool for stock trend analysis on a daily chart. When a strong blue-chip stock pulls back to its 50-day line after a rally, it often bounces. This happens because mutual funds and hedge funds use this average as a benchmark to accumulate shares without spiking the price.
If the price closes decisively below the 50-day MA on high volume, it’s a warning sign. It suggests the intermediate trend is broken, and the “smart money” is no longer supporting the stock at that level.
Trader Tip: Don’t just set a limit order exactly at the 50-day line. Wait for a reversal candle (like a hammer or bullish engulfing pattern) to confirm that buyers have actually stepped in.
The Long-Term Filter: The 200-Day MA
The 200-day moving average strategy is simple but non-negotiable for conservative traders: never long a stock trading below this line.
While the 50-day is for timing, the 200-day MA is for filtering. It tells you the “weather” of the stock. If the price is above the 200-day, it’s sunny (bull market). If it’s below, it’s raining (bear market). Institutional algorithms often have hard rules against buying stocks trading below this average.
This line is also critical for spotting major trend reversals. A situation where the 50-day crosses above the 200-day is known as a golden cross. While powerful, golden cross stocks can sometimes lag, so they should be used to confirm a long-term bias rather than a short-term trigger.
For a deeper look at long-term signals, check out our guide on the Moving Average Crossover Strategy.
Screening for High-Momentum Stocks
Finding the best swing trade candidates involves scanning for stocks where price, the 50-day, and the 200-day are stacked in the correct order.
You want to see a specific alignment: Price > 50-day MA > 200-day MA. This “stacked” alignment confirms that momentum is building across all timeframes.
- Price Action: The stock should be making higher highs and higher lows.
- Support Check: Look for stocks that have recently tested the 50-day MA and held.
- Volume: Ensure volume increases on up-days and decreases on down-days.
Using a tool to automate this saves hours of manual charting. You can filter thousands of stocks in seconds to find only those exhibiting this healthy behavior.
Ready to find your next trade? Find Stock Broker Malaysia to find stocks trending above the 50-day MA right now.
Is your chart looking messy? Simplifying your view to just these two lines often clarifies the trend immediately.
Conclusion
Using the 50 and 200-day moving averages removes the guesswork from swing trading strategies. The 200-day keeps you on the right side of the major trend, while the 50-day provides actionable support levels for entry. By respecting these institutional levels, you align your capital with the market’s biggest movers rather than fighting against them.
FAQs About Moving Average For Swing Trading
What is the best moving average for swing trading?
The 50-day moving average is widely considered the best for swing trading. It captures the medium-term trend accurately, offering reliable dynamic support levels for entry during pullbacks without being as noisy as shorter-term averages like the 10 or 20-day.
How do you trade the 50 and 200 day moving average?
Traders use the 200-day MA as a trend filter (only buy if price is above it) and the 50-day MA as an entry trigger. A common strategy is to wait for a stock in an uptrend to pull back to the 50-day line and buy on a bounce.
Is the 200 day moving average a buy or sell signal?
It is primarily a trend filter rather than a direct signal. However, if the price crosses firmly above the 200-day MA, it is a long-term buy signal (bullish). If it crosses below, it acts as a sell or “stay away” warning (bearish).
What happens when the 50 day crosses the 200 day?
When the 50-day crosses above the 200-day, it is called a “Golden Cross,” signaling a long-term bull market. Conversely, when the 50-day crosses below the 200-day, it is a “Death Cross,” indicating a potential long-term bear market.
Do banks use the 50 day moving average?
Yes, institutional investors, banks, and hedge funds watch the 50-day moving average closely. It is often referred to as the “institutional line” because large buy orders tend to sit at this level to accumulate shares during a trend.
Why is the 200 day moving average so important?
It represents roughly one year of trading data. Because it is so widely watched by major financial institutions and algorithms, it becomes a self-fulfilling prophecy, often acting as a massive floor of support or a ceiling of resistance.