Key Takeaways
- Repainting Verdict: The authentic XHMaster Formula is non-repainting; signals stay fixed after the candle closes, but they do lag behind price action.
- Core Logic: It is not a magic tool; it aggregates EMA, MACD, RSI, and Stochastic data into a single visual line.
- Best Strategy: Never use it alone. Combine with a 200 EMA to filter trends and avoid false signals in ranging markets.
- Ideal For: Scalping (M5-M15) on high-volatility pairs like GBP/USD and XAU/USD during London/NY sessions.
- Version Warning: Many “2025 Pro” versions are fake re-uploads; the classic v3.6 or “Gold” versions are often the most stable.
Is the XHMaster Formula the Holy Grail of Forex Indicators?
No, but it is one of the cleanest trend-confirmation tools available among the Top MT4 Indicators.
Traders are constantly hunting for the mythical “zero-lag, non-repaint” indicator. The XHMaster Formula Indicator (2024 Edition) often pops up in forums as a top contender, promising easy-to-read buy/sell arrows without the chaos of a cluttered chart. But does it actually work in live trading, or does it just look pretty in hindsight?
This guide breaks down exactly how the indicator works, exposes the truth about its “repainting” behavior, and gives you a tested strategy to use it effectively without blowing your account.
🧾 XHMaster vs. Standard Indicators Comparison
Immediate Comparison: Why use this over a standard MACD?
| Feature | XHMaster Formula | Standard MACD | Relative Strength Index (RSI) |
| Visual Style | Color-coded Line + Arrows | Histogram + Signal Line | Single Line (0-100) |
| Repainting | No (On Candle Close) | No | No |
| Best For | Trend Confirmation | Momentum Divergence | Overbought/Oversold |
| Lag Factor | Medium-High (Smooths noise) | Medium | Low (Reactive) |
| Ideal Market | Strong Trends (Volatile) | Trends & Reversals | Ranging & Reversals |
What is the XHMaster Formula Indicator?
The “Black Box” Decoded
Many traders download the XHMaster Formula thinking it uses a secret algorithm. In reality, code analysis reveals it is a composite indicator. It calculates a normalized value based on a blend of:
- Fast & Slow EMAs (Exponential Moving Averages) for trend direction.
- MACD for momentum strength.
- RSI & Stochastic to detect exhaustion points.
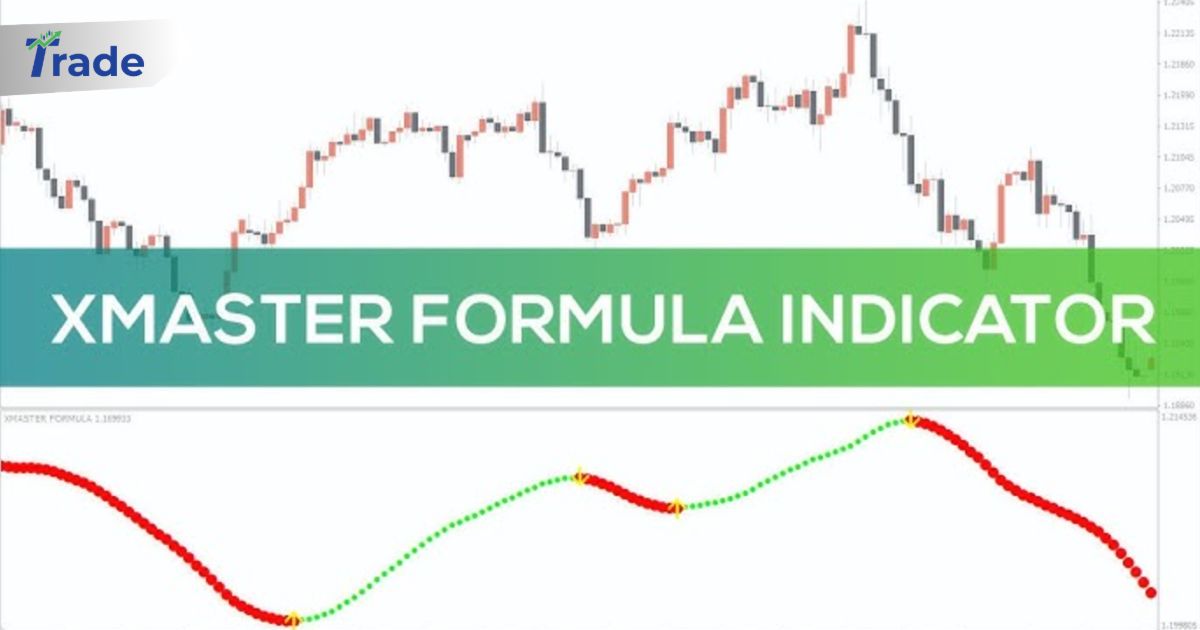
Instead of showing you four different windows, it compresses this data into a single red/green line on your main chart.
2024 vs. Older Versions
You will see filenames like XMaster_Formula_v7, XHMaster_Gold_2024, or X-Master Pro.
- The Reality: Most “2024” versions are simply the classic code (circa 2012-2015) renamed by marketers or forums.
- The Fix: Stick to the standard version (often v3.6 or similar) found on reputable repositories like MQL5 or Forex Factory. Avoid paying for “Premium” versions that claim to be AI-powered; they are usually scams.
🛑 The “Repainting” Controversy: Solved
This is the #1 question: Does XHMaster repaint?
The Definition
- Repainting: The indicator signals a BUY, but if the price drops 5 minutes later, the arrow disappears from the past candle as if it never happened.
- Lagging: The indicator signals a BUY, but it appears 1-2 candles late after the move has already started.
The Verdict
The legitimate XHMaster Formula is NON-REPAINTING.
Once a candle closes and an arrow appears, that arrow will remain there forever. However, because it relies on Moving Averages, it lags. It will often signal an entry after the initial breakout spike. This makes it safe for backtesting but requires patience in live trading.
Warning: If your version changes past signals when you refresh the chart, delete it immediately. You have a corrupted or fake “snake oil” version.
⚙️ Best Settings & Trading Strategy
Do not use the default settings blindly. The default parameters are often too sensitive, leading to “whipsaws” (false signals) in sideways markets.
Optimized Settings for Scalping (M5 / M15)
- Email/Alerts: Set to True (Crucial so you don’t stare at charts).
- EMADifference: Increase slightly if you get too many signals.
- Period: Default is often 10. Change to 14 or 21 to filter out market noise.
The “Trend-Filter” Strategy
Never trade XHMaster signals against the main trend.
✅ Buy Setup (Long)
## 1. Primary Trend Check
**Is price above the 200 EMA?**
Look at the 200-period Exponential Moving Average. If price is ABOVE it, you are only looking for BUY signals. Ignore all red arrows.

## 2. The Signal
**Wait for the XHMaster Line to turn GREEN.**
Ensure a Green Arrow appears pointing UP.

## 3. The Trigger
**Enter on the CLOSE of the signal candle.**
Do not enter while the candle is still moving (it might repaint before close).

## 4. Stop Loss & Take Profit
**SL**: Below the recent Swing Low.
**TP**: 1.5x Risk OR Exit when the line turns RED.
✅ Sell Setup (Short)
## 1. Primary Trend Check
**Is price below the 200 EMA?**
If price is BELOW the 200 EMA, you are only looking for SELL signals. Ignore all green arrows.

## 2. The Signal
**Wait for the XHMaster Line to turn RED.**
Ensure a Red Arrow appears pointing DOWN.

## 3. The Trigger
**Enter on the CLOSE of the signal candle.**

## 4. Stop Loss & Take Profit
**SL**: Above the recent Swing High.
**TP**: 1.5x Risk OR Exit when the line turns GREEN.
📉 Visual Mastery: Analyzing the Chart Patterns
The XHMaster Formula isn’t just a “Red Light, Green Light” tool. If you look closely at the angle and proximity of the line in your chart, it tells a deeper story about market psychology.
1. The “45-Degree” Rule (Momentum Strength)
- Strong Trend: When the line slopes up or down at a steep angle (approx. 45 degrees), momentum is high. This is the safest time to hold a trade.
- Weak Trend: If the line is Green but almost flat (horizontal), the trend is weak. Price often reverses here. Avoid adding new positions.
2. The “Magnetic” Gap (Pullback Strategy)
Notice how price often runs away from the line, then snaps back to touch it?
- The Gap: When price candles are far away from the XHMaster line, the market is overextended. Do not chase.
- The Touch: A common strategy is to wait for price to pull back and touch the Green line. If it touches and bounces up, it’s a perfect re-entry signal (adding to your winner).
3. The “Flat-Line” Trap (Sideways Market)
In consolidation zones, the XHMaster line becomes horizontal and thin. It may flicker red/green frequently.
- Visual Rule: If the line looks like a flat snake, DO NOT TRADE. Wait for the mouth of the snake to open wide (expand) in one direction.
4. Customizing Your Visuals
If your indicator looks different from standard screenshots:
- Line Thickness: Go to Indicator Properties > Colors. Increase the width of the Green/Red lines to 3 or 4 to make the trend easier to see on 4K monitors.
- Arrow Size: You can usually adjust ArrowCode or ArrowSize in the inputs if the default arrows are too small or cluttering the candles.
⚠️ Common Mistakes to Avoid
1. Trading in “Choppy” Markets
XHMaster fails in ranging markets. If the line is constantly flipping Green-Red-Green every few candles, the market is sideways. Stand aside. This usually happens during the Asian session for pairs like EUR/USD.
2. Chasing the Arrow
Because the indicator lags, a huge candle might appear before the arrow. If the price has already spiked 20+ pips away from the moving average, do not enter. You are buying at the top. Wait for a pullback (retest).
3. Ignoring Fundamental News
No indicator can predict NFP (Non-Farm Payrolls) or Interest Rate decisions. Disable your trading logic 30 minutes before high-impact news events.
Final Verdict
The XHMaster Formula MT4 Indicator is a solid tool for discipline. It forces you to wait for a confirmed color change before entering, preventing impulsive “gut feeling” trades.
However, it is not a strategy in itself. It is a part of a system.
Use it to time your entry, but use Market Structure and the 200 EMA to plan your trade.
FAQs About XHMaster Formula Indicator
Where can I download the XHMaster Formula Indicator for free?
You can find safe, open-source versions on the MQL5 codebase or the Forex Factory forums. Avoid “paid” download links on YouTube; the tool is historically free.
Does it work on mobile MT4?
No. Custom indicators (.ex4 or .mq4 files) only work on the Desktop (PC/Mac) version of MetaTrader 4/5. You cannot install it on iPhone or Android.
Can I use it for Crypto/Bitcoin?
Yes, but increase the period settings. Crypto is more volatile, and default forex settings will generate too many false signals.
What is the success rate?
In a trending market, it can hit 70-75% accuracy. In a ranging market, accuracy drops below 40%. This is why the 200 EMA filter is mandatory
Is XHMaster better than “Forex Gump” or “HalfTrend”?
They are similar. XHMaster is visually cleaner (just a line and arrow), whereas HalfTrend shows stops. XHMaster is preferred by traders who want a minimalist chart.