Key Takeaways
- Price action removes the noise of economic forecasts, allowing you to trade the market’s actual reaction rather than the news number.
- Zones must be drawn beforehand on higher timeframes (H1/H4) to establish a clear battlefield map before volatility strikes.
- Patience prevents capital destruction by forcing you to wait for a confirmed candle close, avoiding common liquidity traps.
- Specific patterns trigger entries, specifically rejection wicks or engulfing bars occurring exactly at your pre-marked levels.
- Risk is managed via structure, placing stop-losses behind the signal candle to protect against violent market whipsaws.
What is the safest way to trade NFP?
The most effective strategy for trading Non-Farm Payroll (NFP) is a pure Price Action approach.
By mapping Support and Resistance zones before the release and executing trades only after a candlestick pattern confirms a reaction at those levels, traders can capture high-volatility moves without gambling on economic data predictions.
It is 8:30 PM on a Friday night in Kuala Lumpur. You are watching the charts, coffee in hand, waiting for the US labor data to drop.
This is the moment where retail accounts are either doubled or blown in seconds.
The biggest mistake traders make is trying to outsmart the economists by guessing the unemployment rate.
You do not need to be an economist.
You simply need to read the story the candles are telling you in real-time. This guide breaks down a professional “reactive” strategy that ignores the news data and focuses entirely on market psychology.
Comparison: NFP Trading Approaches
| Strategy | Best For | Key Focus | Pros | Cons |
| Price Action (Recommended) | Precision Scalping | Candlestick Patterns | Reacts to real flow; avoids bias | Requires high discipline; fast execution |
| News Straddle | Catching Spikes | Buy/Sell Stop Orders | Catches move in any direction | High slippage risk; spreads can widen |
| Fundamental Bias | Swing Trading | Economic Forecasts | logical; aligns with macro trends | Market often moves opposite to logic |
| Indicator Systems | Trend Following | RSI, MACD, MA | specific rules; easy to follow | Indicators lag too much for NFP speed |
| Post-News Fade | Reversals | Overbought/Oversold | High reward on false breakouts | Risky if the trend is genuine and strong |
1. The Preparation Phase: Mapping the Zones
You cannot build a shelter when the storm has already started.
Trading NFP without pre-marked zones is financial suicide. The market moves too fast—often 50 to 100 pips in seconds—for you to analyze structure in real-time. Your preparation must begin at least 30 minutes before the release.
Switch your chart to a higher timeframe, such as the 1-Hour (H1) or 4-Hour (H4). Look for obvious peaks and valleys where price has reversed sharply in the past. Draw horizontal lines through these levels. These are your “Kill Zones.”
- Support: Where buyers have historically stepped in.
- Resistance: Where sellers have historically defended.
You are not predicting that price will stop there. You are simply marking these areas as “points of interest.” If price approaches these lines during the news release, you will watch for a reaction. If price is in the middle of nowhere (between zones), you sit on your hands.
Trader’s Rule: “If there is no zone, there is no trade. We do not trade in ‘no man’s land’.”
2. The Trigger: Identifying “Money Making” Patterns
The chart tells you who is winning the war: buyers or sellers.
Once the news drops, price will likely spike towards one of your zones. Do not simply place a limit order and hope. You must wait for a specific visual confirmation that the zone is holding. We look for two primary “familiar patterns.”
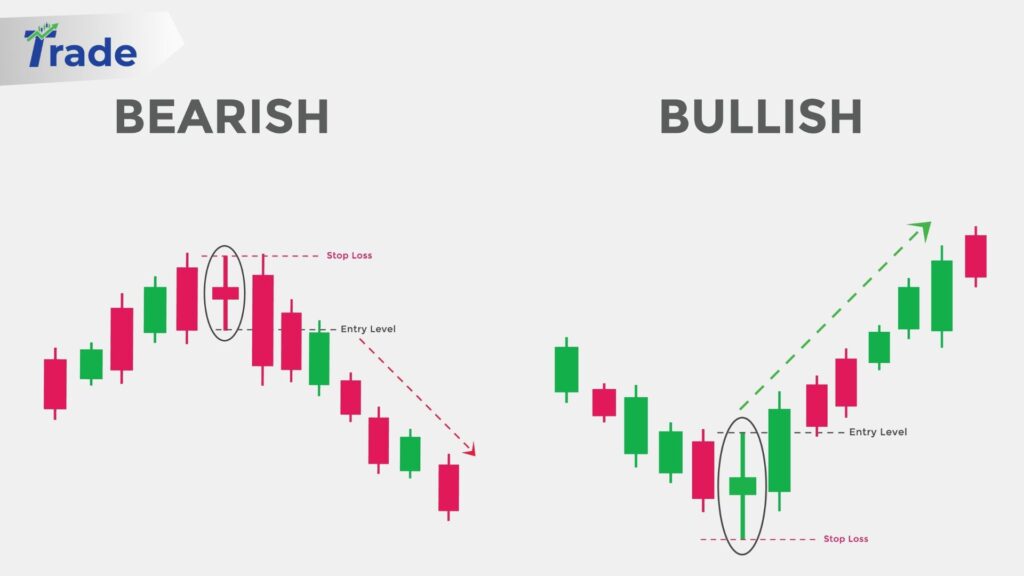
The Rejection Wick (Pin Bar)
This occurs when price spikes through your zone but snaps back aggressively before the candle closes. It leaves a long “wick” or “tail” behind.
- Bullish Rejection: Price dips into Support, but buyers push it back up, leaving a long lower wick.
- Bearish Rejection: Price spikes into Resistance, but sellers slam it down, leaving a long upper wick.
The Engulfing Candle
This is a momentum shift signal.
- Bullish Engulfing: A red candle hits support, followed immediately by a massive green candle that completely “eats” or covers the previous red body.
- Bearish Engulfing: A green candle hits resistance, followed by a massive red candle that engulfs the previous green body.
These patterns are your green light. They confirm that the “Smart Money” (banks and institutions) is defending that price level.
3. The Golden Rule: Wait for the Close
A candle is not a signal until it is finished.
This is where 90% of traders fail. Imagine you are watching the 5-minute (M5) chart. The NFP data releases, and a green candle rockets up towards your resistance zone. It looks like a massive breakout. You click “Buy.”
Ten seconds later, the price reverses. That “breakout” candle collapses and closes as a massive red rejection wick. You are now trapped in a losing trade at the absolute top.
The Fix:
You must sit on your hands until the clock hits the 5-minute mark (e.g., 8:35 PM, 8:40 PM). Only when the candle officially closes and “prints” the pattern do you enter the trade.
- If it closes as a breakout: Wait for a retest.
- If it closes as a rejection pattern: Enter the reversal trade immediately.
4. Execution & Risk Management
Protect your downside before you think about the upside.
Once you enter the trade based on a confirmed pattern at a confirmed zone, you must immediately place your protection.
- Stop Loss Placement: Place your Stop Loss (SL) just above the wick of the rejection candle (for a sell) or just below the wick (for a buy). If price breaks that wick, your trade idea is invalid, and you want to be out.
- Take Profit: Target the next zone. If you sold at Resistance, your target is the nearest Support level.
- Breakeven: Since NFP is volatile, move your Stop Loss to “Breakeven” (your entry price) as soon as the price moves 1:1 in your favor. This ensures a “risk-free” trade.
Scenario:
You see a Bearish Engulfing pattern at Resistance.
- Entry: 1.0550
- Stop Loss: 1.0565 (15 pips risk)
- Target: 1.0505 (45 pips reward)
- Result: 1:3 Risk-to-Reward Ratio.
Still unsure about live execution?
- Backtest First: Use a strategy tester (like on MT4/MT5) to replay old NFP days.
- Reduce Size: Trade with 0.01 lots until you prove you can wait for the candle close.
- Focus on Gold (XAUUSD): It respects technical zones very well during NFP, though it is highly volatile.
Mastering Volatility with Discipline
NFP does not have to be a gamble. By treating it as a technical event rather than a fundamental guess, you regain control. The market provides the volatility; you provide the structure.
Remember, the goal is not to catch every pip. The goal is to catch the high-probability moves that occur when price proves it cannot break a key level.
FAQs About Trading NFP
What timeframe is best for this strategy?
The 5-minute (M5) or 15-minute (M15) timeframes are ideal for execution. They offer a balance between seeing the detail of the price action and filtering out the 1-minute noise.
Does this work on all currency pairs?
It works best on pairs directly affected by the USD data, such as EURUSD, GBPUSD, USDJPY, and Gold (XAUUSD). Cross pairs like EURGBP may not react as strongly.
How do I handle “Slippage”?
Slippage (getting filled at a worse price than you clicked) is common during NFP. To minimize this, avoid market orders during the initial spike. Waiting for the candle close helps, as the liquidity usually stabilizes slightly after the first few minutes.
What if the price shoots straight through my zone?
Then you do nothing. A clean break without a rejection pattern means the momentum is too strong to fade. Wait for price to reach the next zone or wait for a “retest” of the broken level.
Can I use this for CPI or FOMC?
Yes. This “Zone + Price Action” methodology applies to almost any high-impact news event (CPI, FOMC, Central Bank Rate Decisions) where volatility is expected.